While the Royal Commission into Misconduct in the Banking, Superannuation and Financial Services Industry in 2018 continues to weigh in on fair charges and fees for residential mortgages, it has also shed some light on the length some Australians are going to in order to secure a home loan.
Over-valuing income from real estate assets and overvaluing the security are two areas of misrepresentation that have been identified. Borrowers provide inaccurate or fraudulent information about income from rental properties on their loan applications and the security value held on file is missing or inaccurate.
Property values across the country
Housing finance data for June 2018 was released by the Australian Bureau of Statistics (ABS) in mid-August which showed continuous slowing of demand for housing, largely driven by investors.
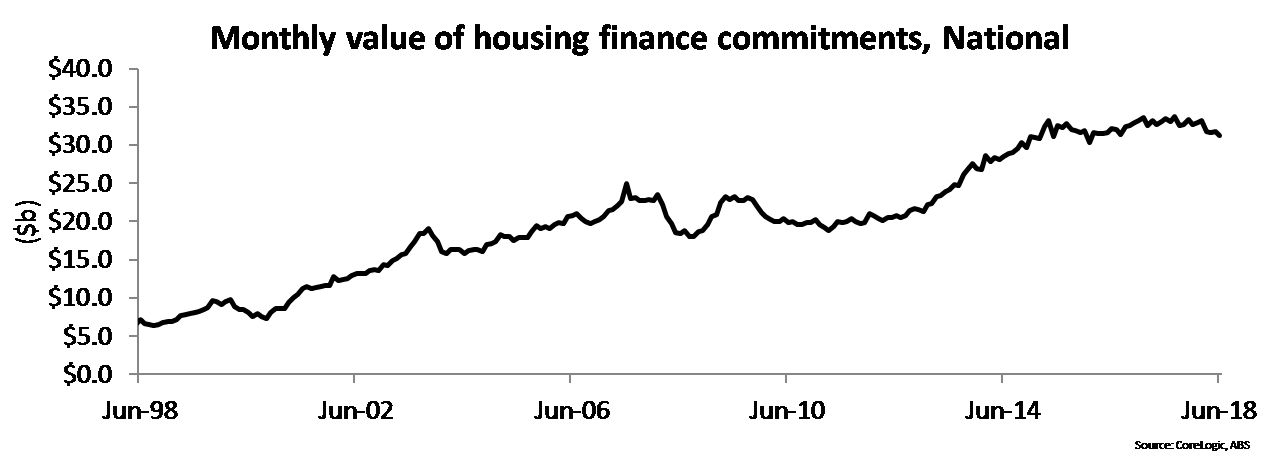
Source: ABS and CoreLogic
According to CoreLogic’s home value index, Australian dwelling values fell for the ninth consecutive month in June this year. This takes the national dwelling values down to 1.3 per cent below their September 2017 peak.
Despite recent and consistent monthly falls, the national dwelling value remains 32.4 per cent higher than what they were just five years ago.
The largest decline amongst the capital cities in the June quarter was in Melbourne, with property values down 1.4 per cent. This was followed by Sydney (-0.9 per cent), Darwin (-0.8 per cent) and Perth (-0.7 per cent).
Outside the capital cities, there was a moderate fall in regional Queensland (-0.2 per cent) and regional Western Australia (-0.1 per cent). The regional markets of Victoria show the highest rate of capital gain (+1.8 per cent), followed closely by regional Tasmania (+1.7 per cent).
Despite the number, these declines are still more pronounced in the most expensive part of the property market.
First home buyers
One of the key drivers of housing demand in the past year has been the rebound of first home buyers. In June 2018, there were 9,541 owner occupier first home buyer finance commitments. As a share of all owner occupier housing finance commitments, first home buyers accounted for 18.1 per cent which is their greatest share since October 2012.
The rebound in demand from first home buyers is largely a result from New South Wales and Victoria state government incentives.
The rental market
Hobart has taken over as Australia’s least affordable city for renters according to new figures. The latest Rental Affordability Index (RAI) shows that Hobart has overtaken Sydney to become the least affordable capital city, followed by Adelaide, Brisbane, Melbourne, Canberra and Perth.
Greater Hobart is now unaffordable even to the average-income household, where the median-rental household has a gross income of $61,300 a year.
The average household in Hobart faces rents of 29 per cent of total income. Greater Sydney remains ‘critically unaffordable’ for low-income households, with the average-rental household spending around 27 per cent of its total income on rent. Greater Melbourne has a gross income of $88,400 a year, and faces housing costs of about 24 per cent of its total income which is classified as ‘acceptable’ by the RAI.
Rental affordability in Perth continues to improve with the average-rental household spending around 21 per cent of its total income.
The third most expensive city is Adelaide, with rental affordability unchanged for the last 18 months. Canberra was the only state capital to see median rents fall across both property types in July.
Rents in Brisbane have also been considered ‘acceptable’ for the first time since the inception of the RAI in 2012, with the average household facing rents of 25 per cent of total income.